Data Engineering • SQL Analytics • Power BI
Uber Ride Analytics
Hi, I'm Derin Girish D G. I transformed 150,000 Uber booking records into a production-style Business Intelligence solution featuring a MySQL star-schema warehouse, 31 SQL analyses, and an eight-page Power BI dashboard.
Project by Numbers
Bookings
SQL Queries
Dashboard Pages
Fact Table
Dimension Tables
Raw Columns
Objectives
Interactive
Project Overview
From raw ride data to a decision-ready analytics system.
This project demonstrates the complete BI lifecycle: data preparation, warehouse modeling, SQL analysis, dashboard design, and business insight communication.
Key Deliverables
- ✓ Cleaned 150k+ records using Python and Pandas
- ✓ Architected a Star Schema data warehouse
- ✓ Engineered a MySQL database with 1 Fact and 7 Dimensions
- ✓ Wrote 31 complex SQL queries to perform business analysis
- ✓ Designed an 8-page Power BI dashboard with actionable insights
Project Lifecycle Timeline
Business Problem
Ride data is valuable only when it explains what is happening and why.
A ride-hailing business needs to monitor demand, revenue, cancellations, vehicle performance, customer behavior, and location-level activity. Raw data alone cannot answer those questions clearly.
Raw operational records
The source CSV contains booking IDs, statuses, locations, ratings, ride distances, payment methods, values, and cancellation fields that need standardization before reporting.
Disconnected questions
Stakeholders need to compare completion, revenue, cancellation reasons, customer experience, vehicle demand, location demand, and time-based performance from one model.
Dashboard storytelling
The final Power BI report had to keep every page focused on a business question, with visuals, insights, and recommendations that are easy to scan.
Project Objectives
Defining success for the analytics solution.
To ensure the project delivered real business value, I established five clear objectives before writing any code.
Architecture
A robust pipeline from raw data to insights.
I designed a complete BI architecture using Python, MySQL, and Power BI to clean, model, and analyze the data efficiently.
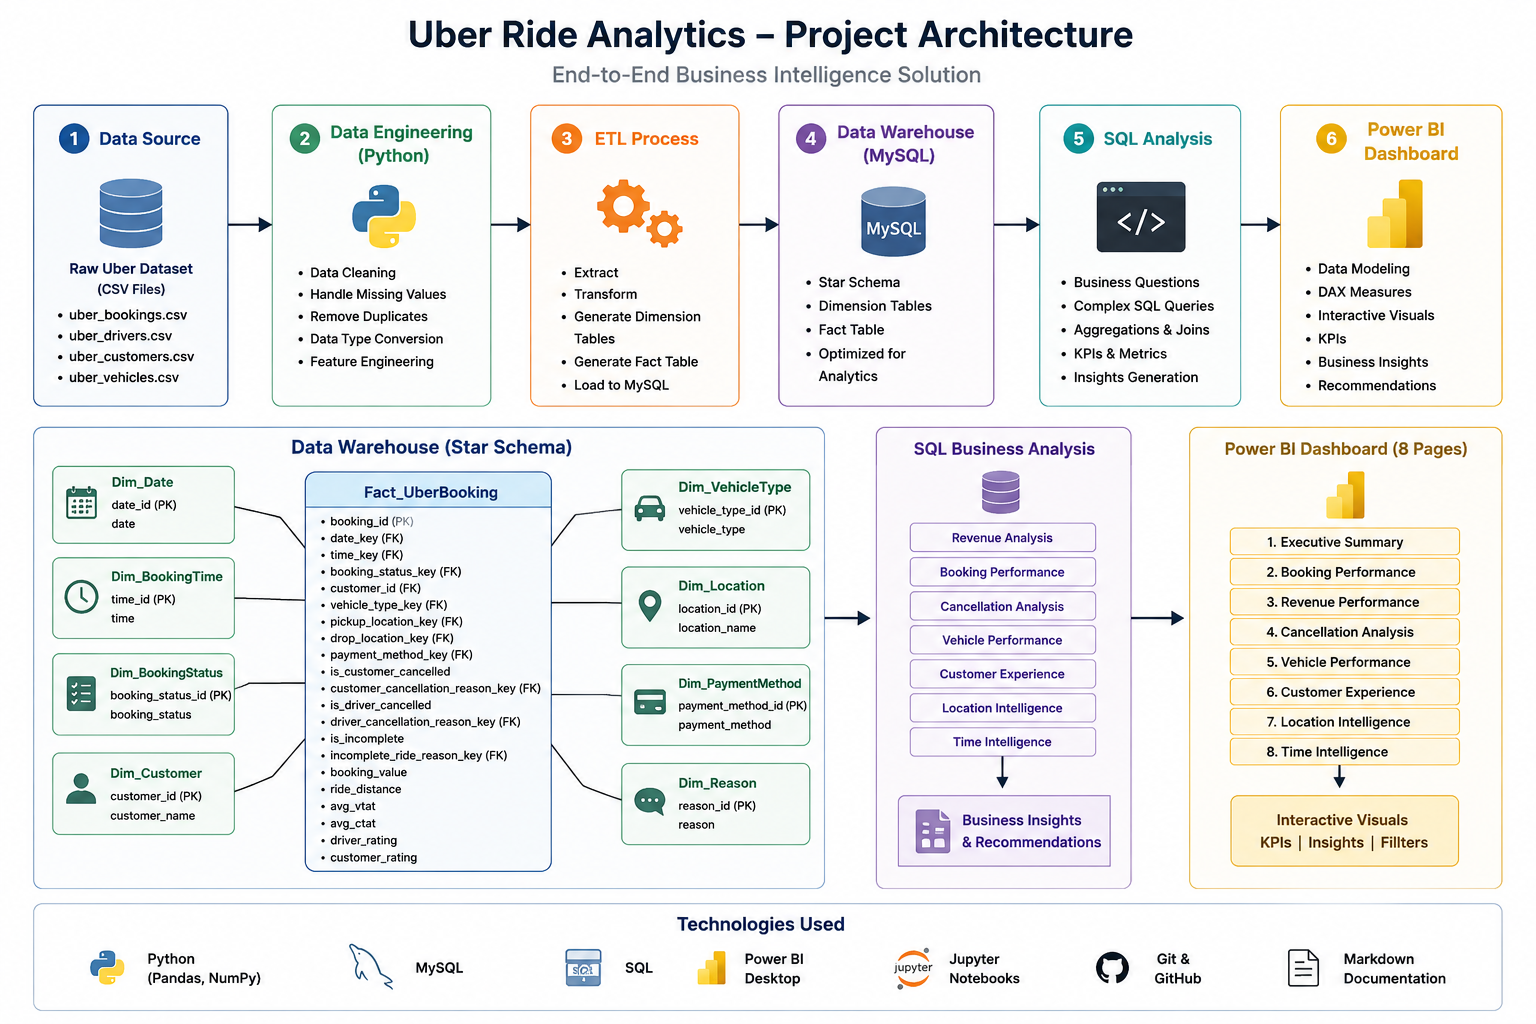
ETL Pipeline
Preparing the data with Python & Pandas.
Raw operational data is rarely ready for analysis. I built a Python ETL pipeline to transform the messy CSV into a structured format.
Data Modeling
Designing the Star Schema.
To optimize query performance and simplify Power BI reporting, I modeled the data into a Star Schema with 1 Fact table and 7 Dimension tables.
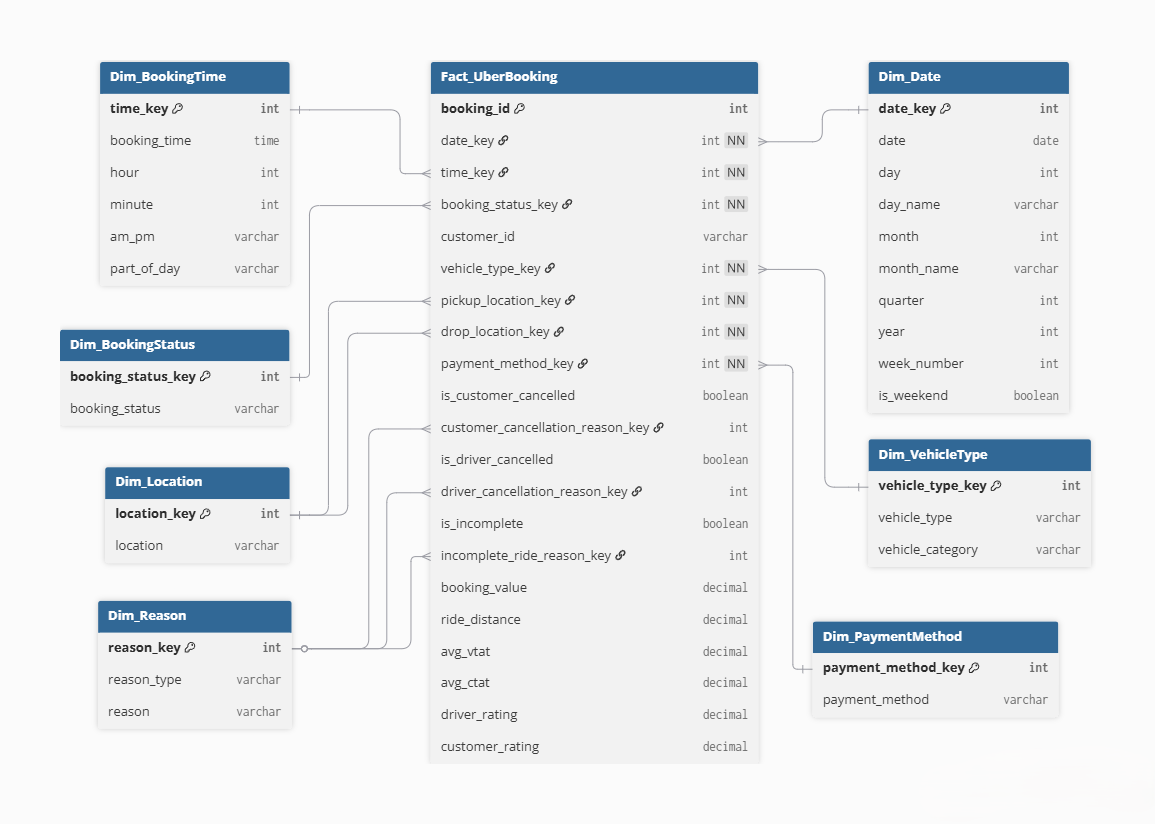
Fact Table
The central
Fact_UberBooking
table stores the quantitative metrics: booking IDs, distances, fares, and foreign keys.
Dimension Tables
Seven surrounding tables provide the descriptive context: Date, Time, Status, Vehicle, Location, Payment, and Reason.
Why Star Schema?
This denormalized structure drastically reduces the complexity of SQL joins and maximizes filtering speed in Power BI DAX calculations.
SQL Analysis
Answering business questions with data.
Before building the dashboard, I wrote 31 complex SQL queries to uncover deep business patterns. Here are five standout questions I solved:
1. Which vehicle generated the highest revenue?
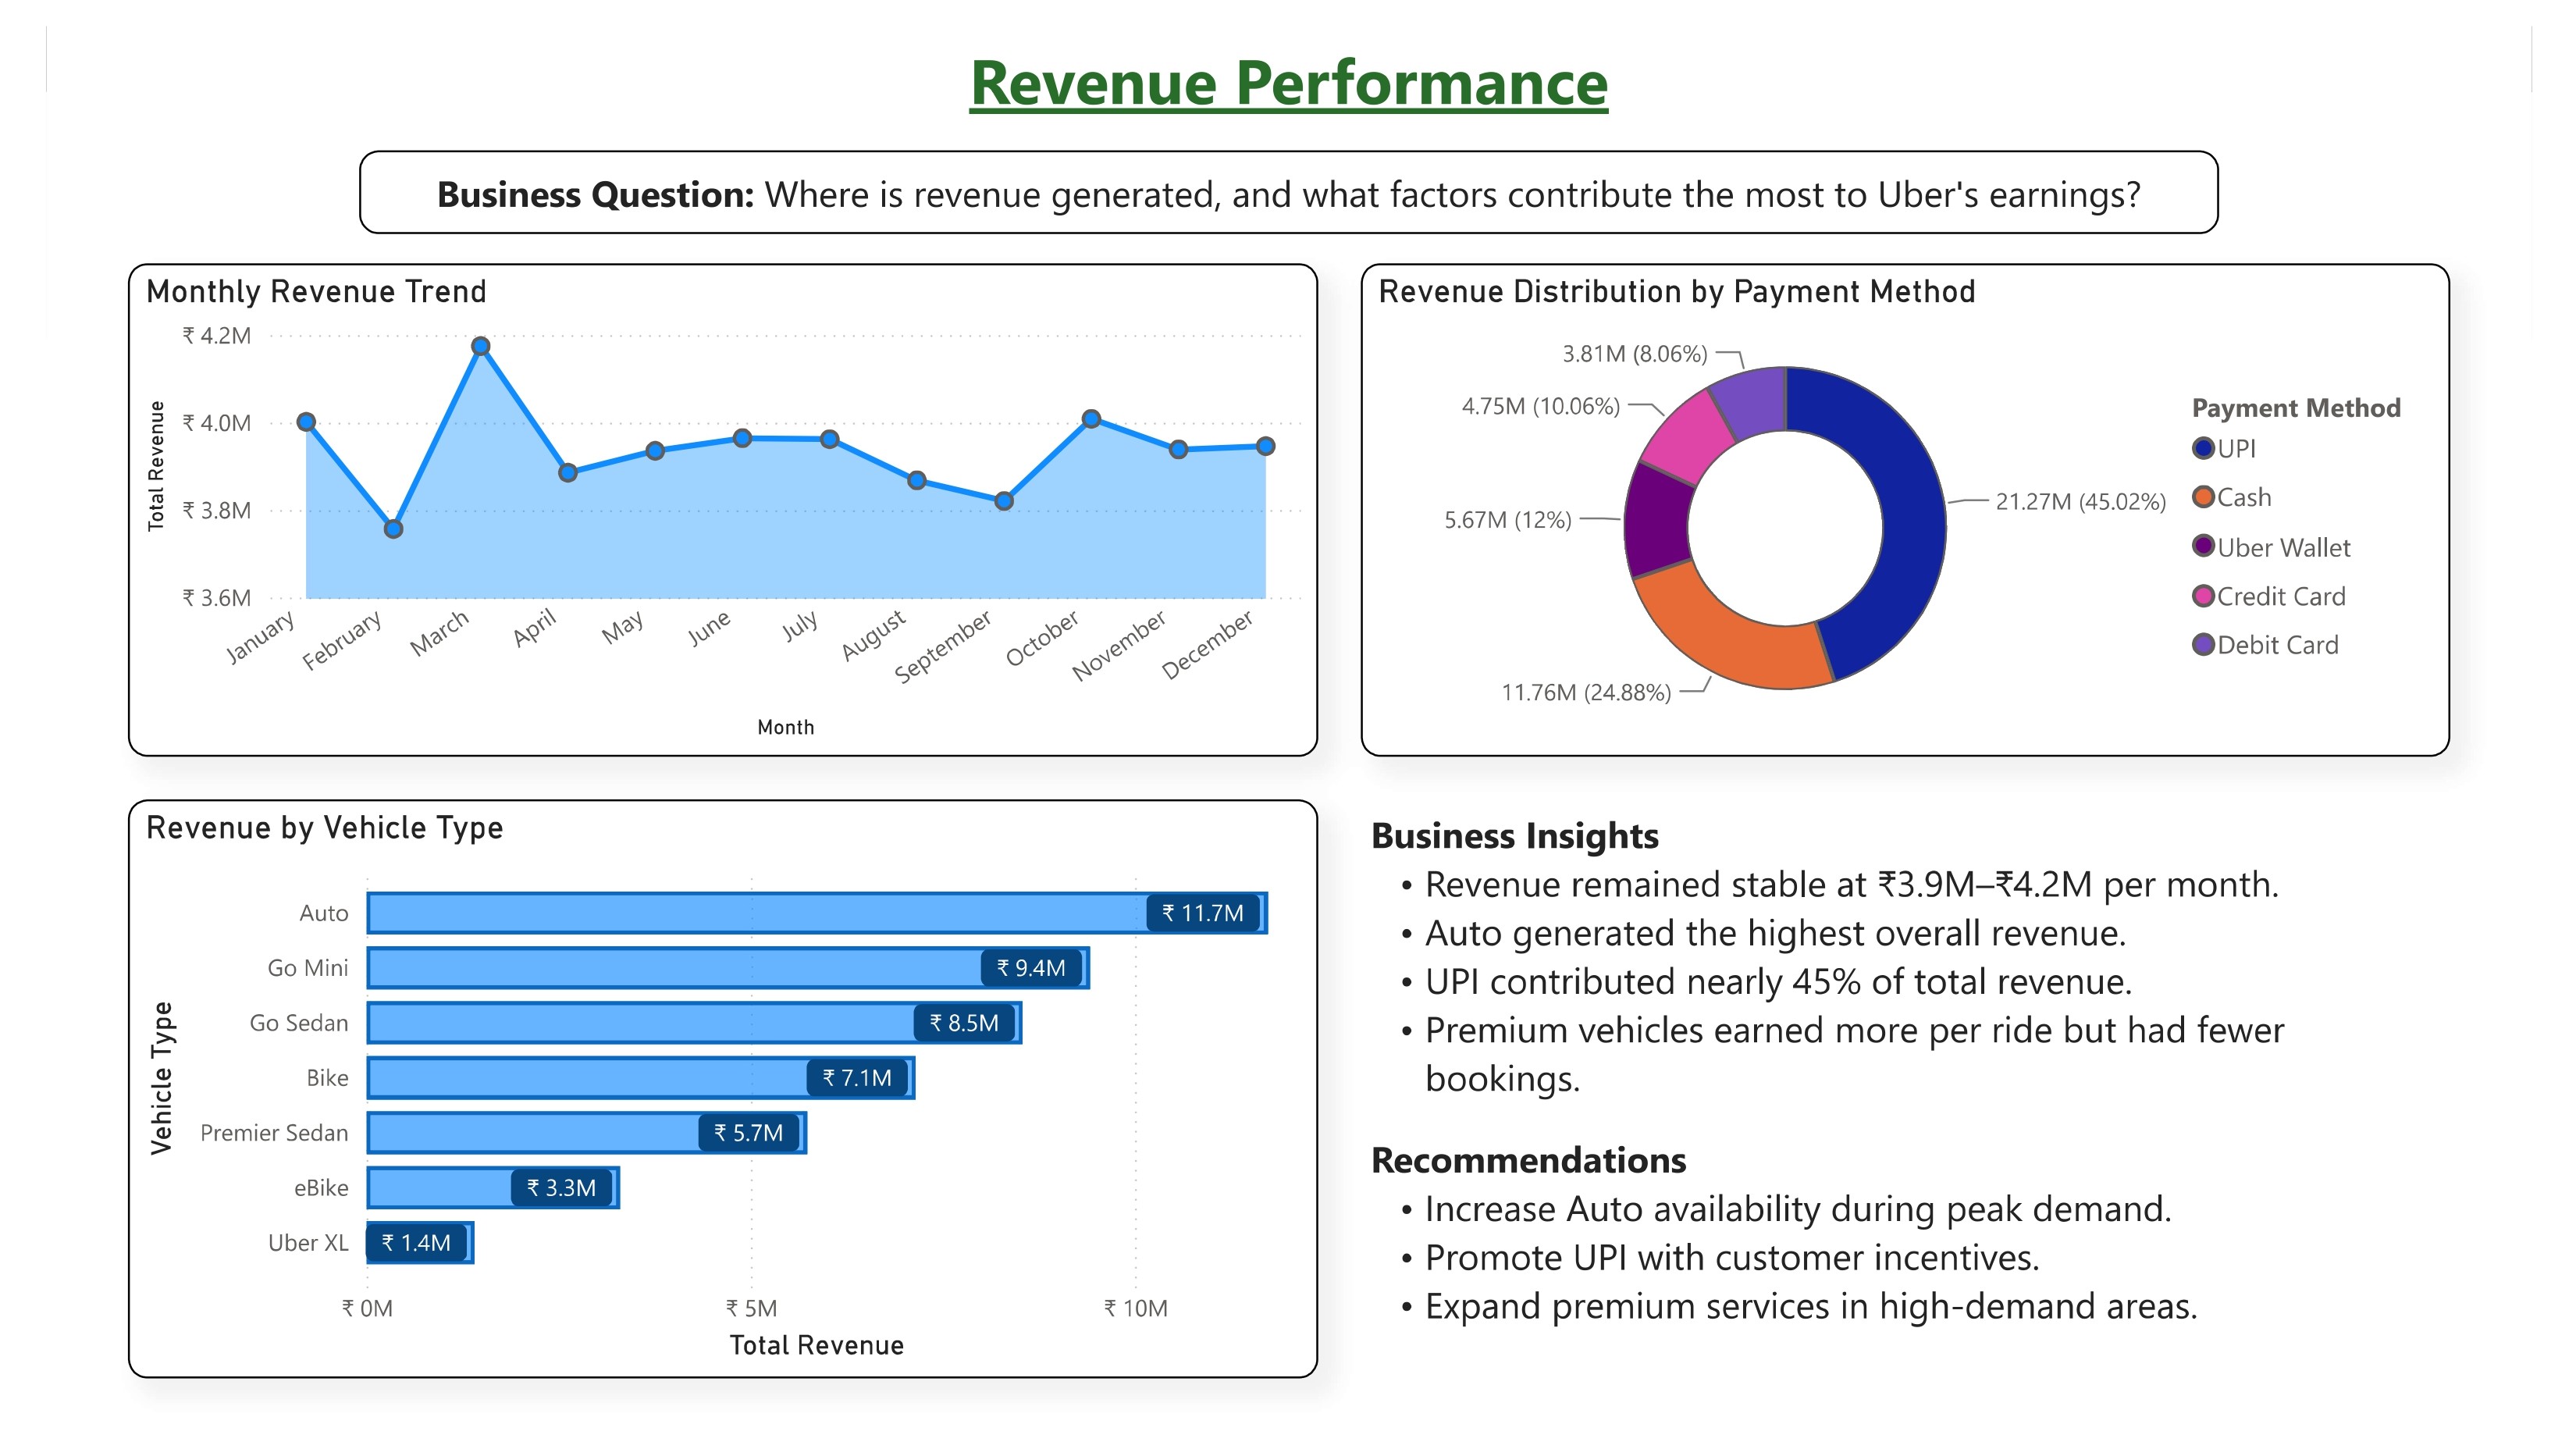
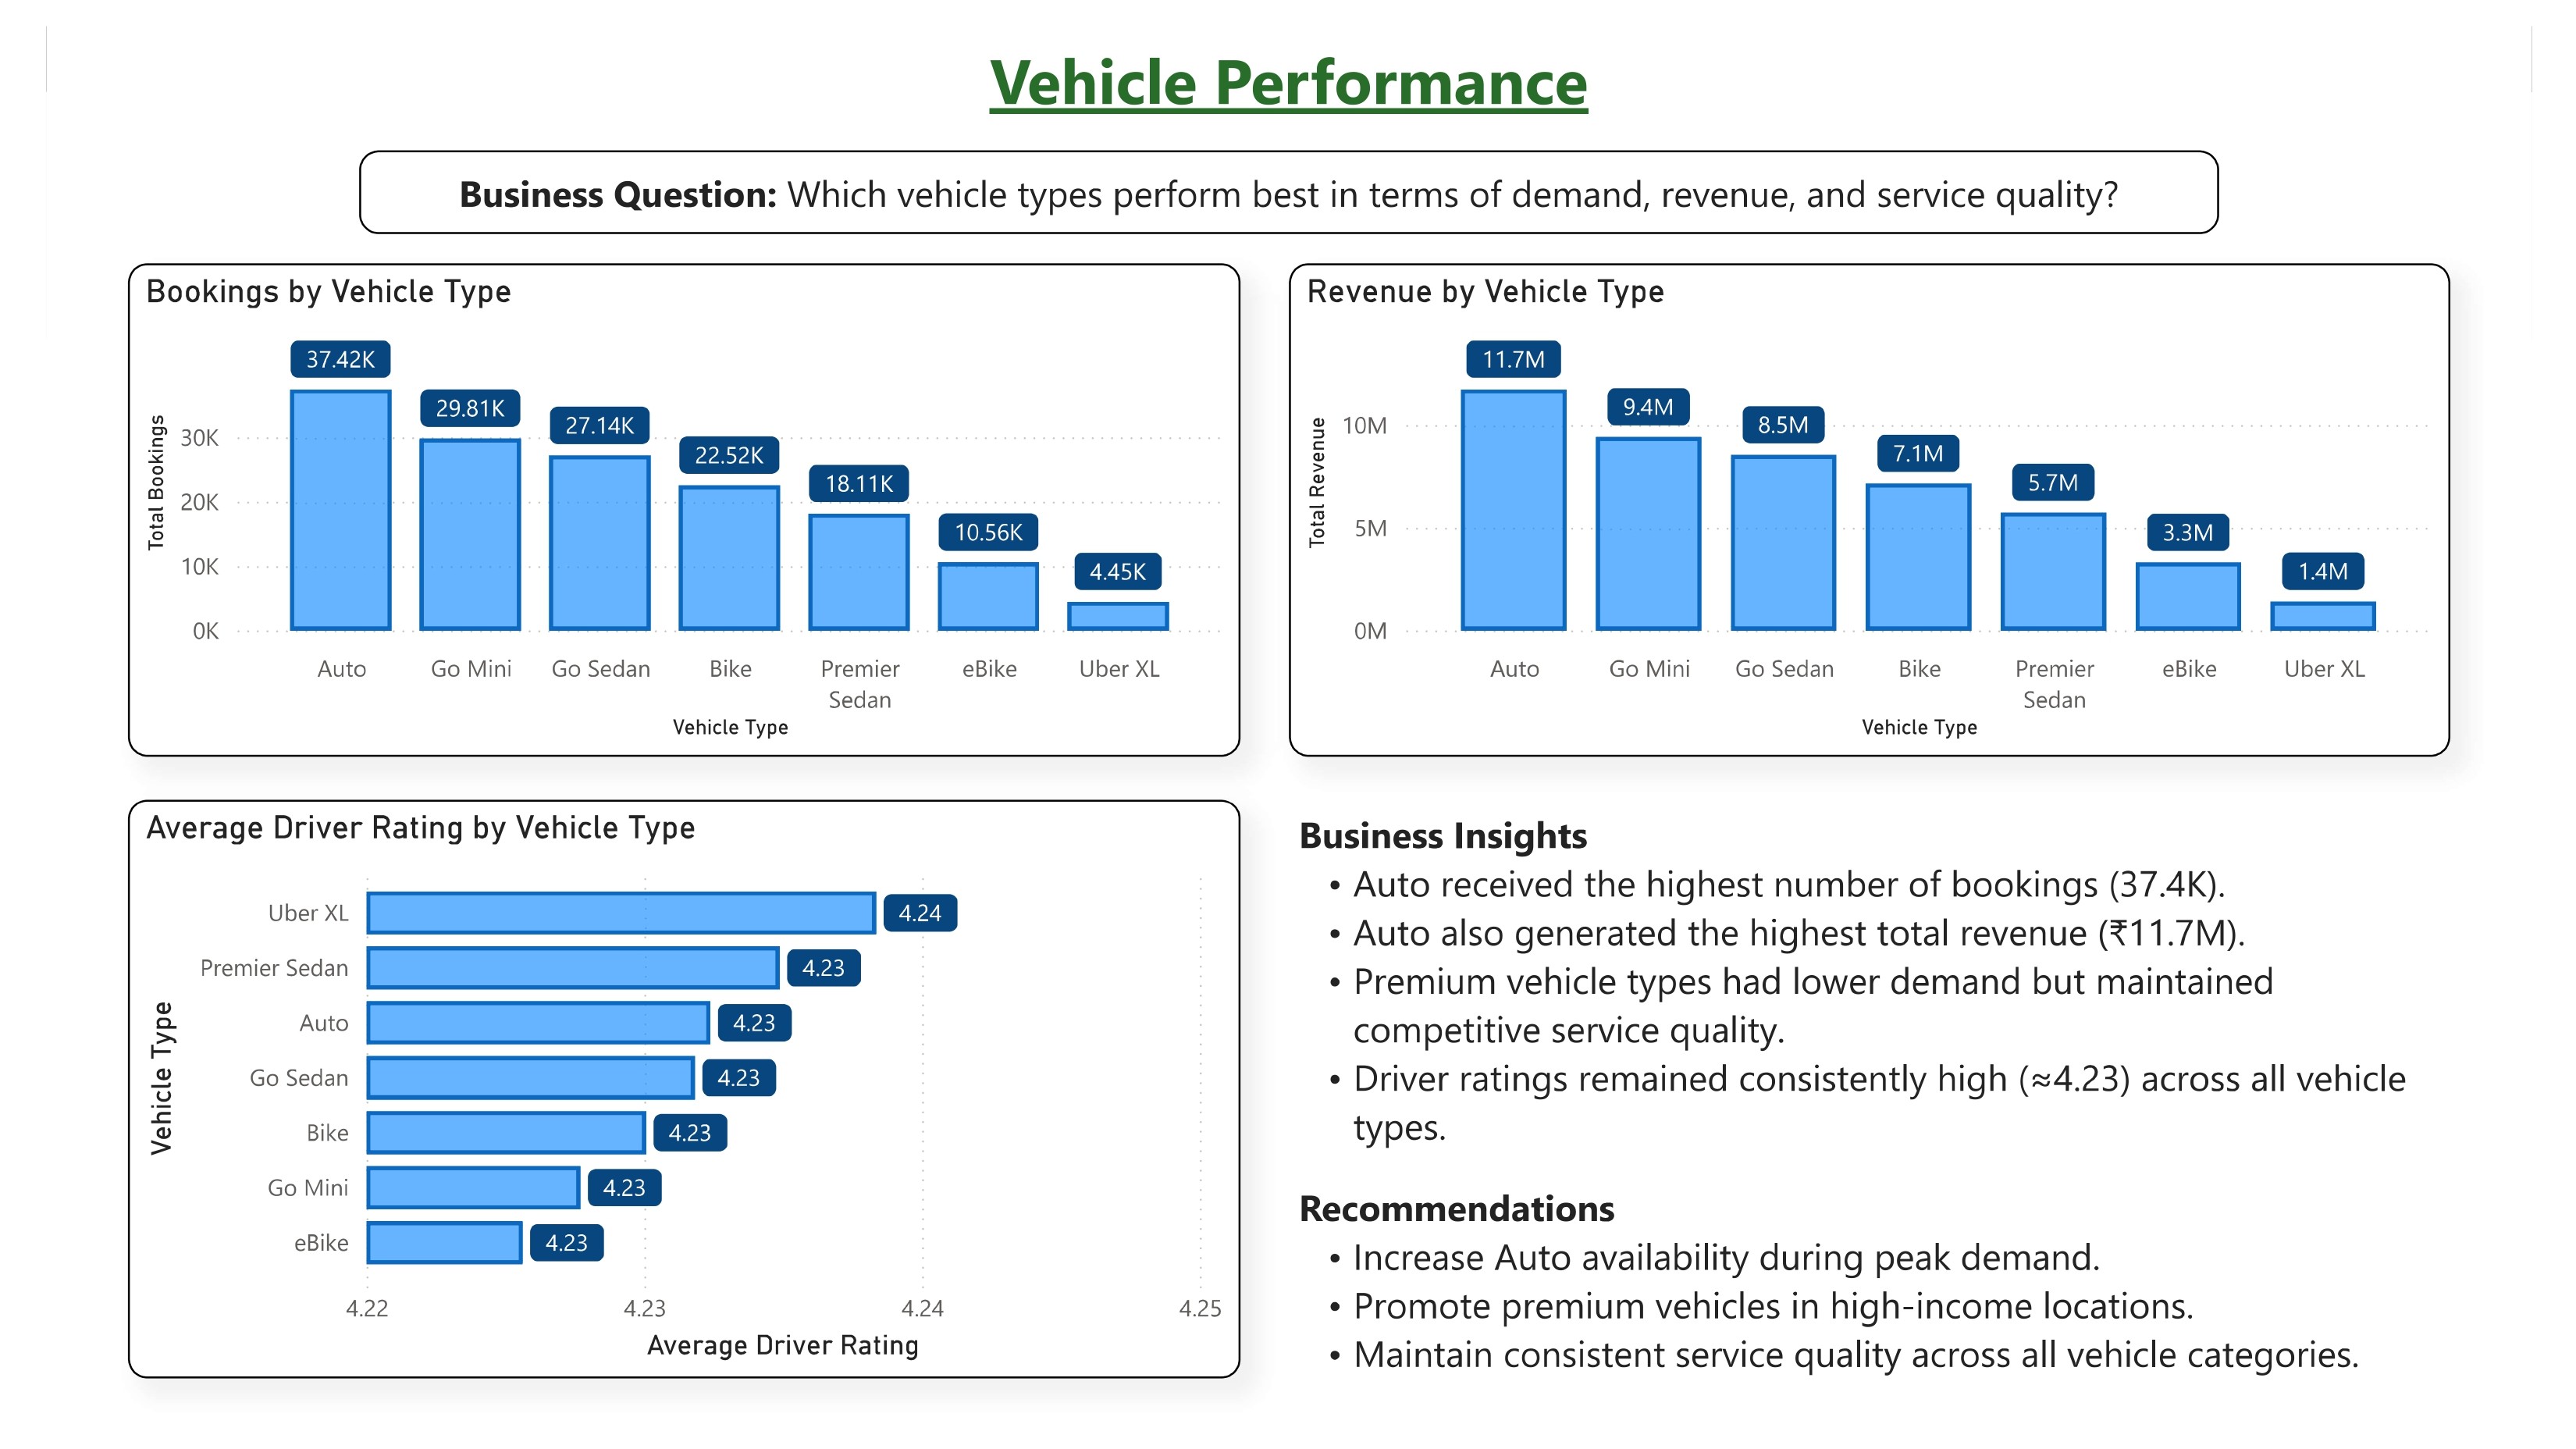
By aggregating fares and joining the Vehicle dimension, I identified that the Auto category leads overall revenue contribution.
2. Which locations had the most pickups?
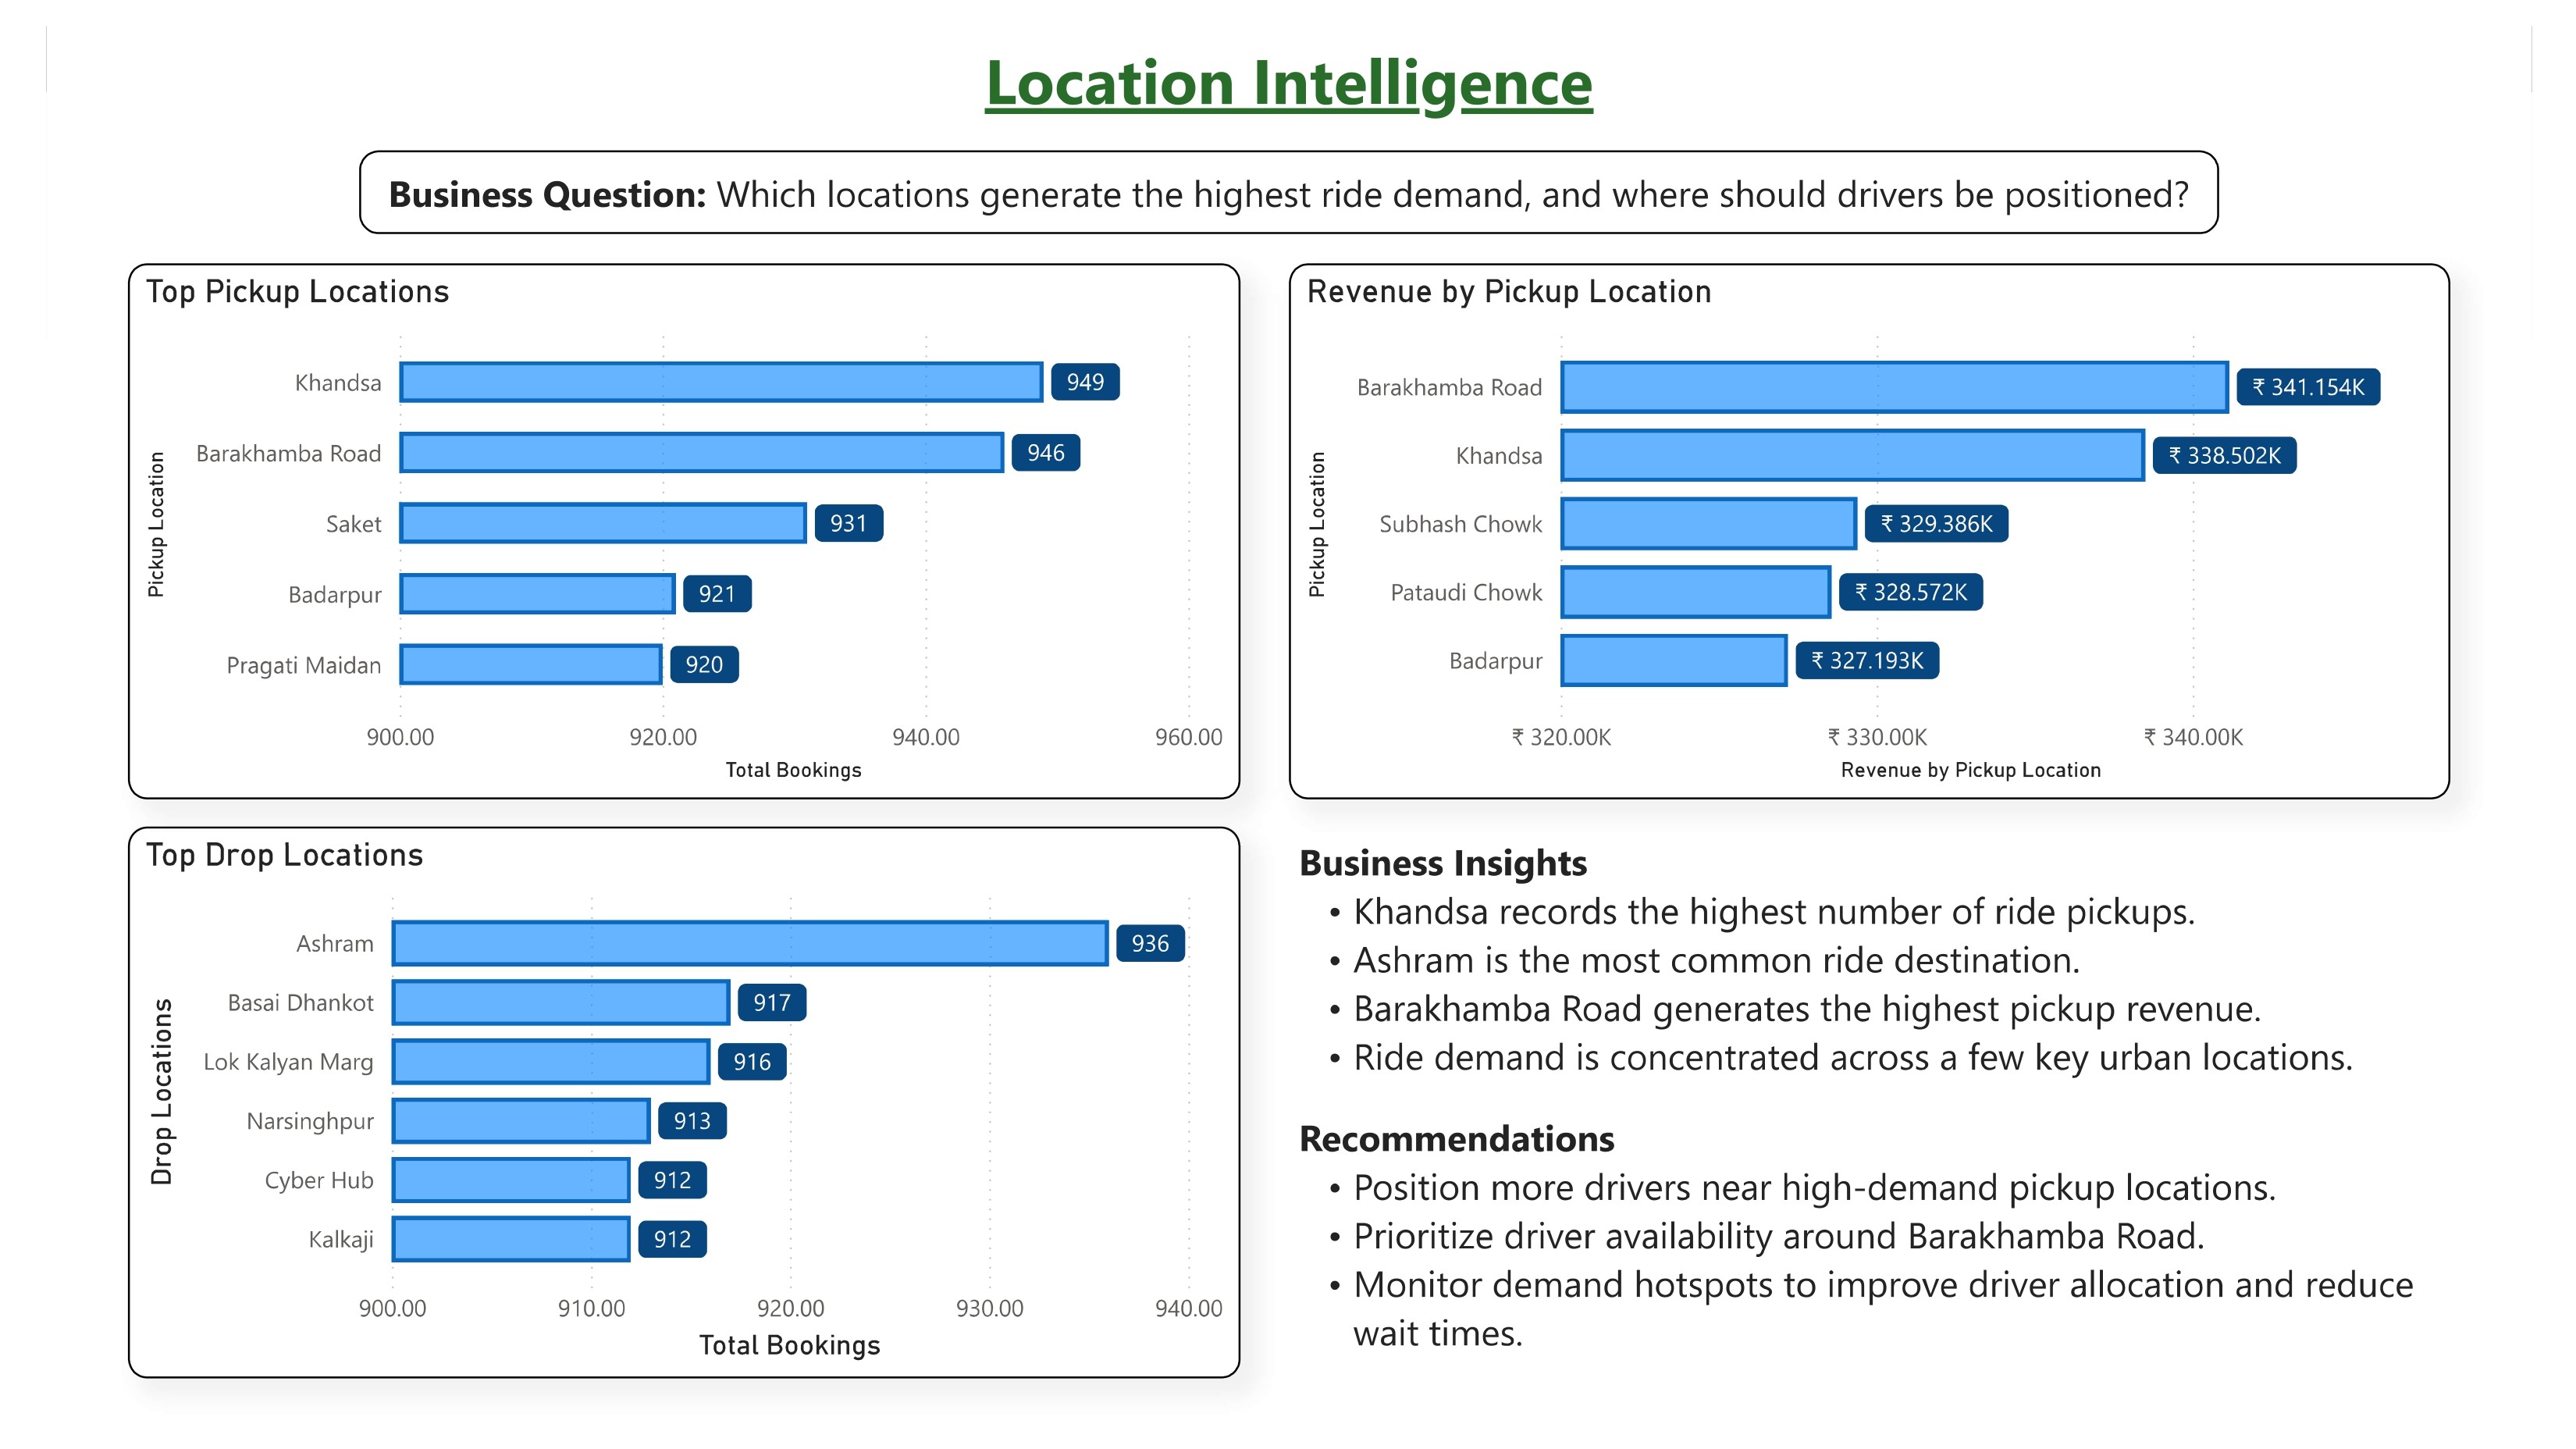
Grouping by pickup location IDs revealed that Khandsa recorded the absolute highest volume of ride requests.
3. When do cancellations peak?
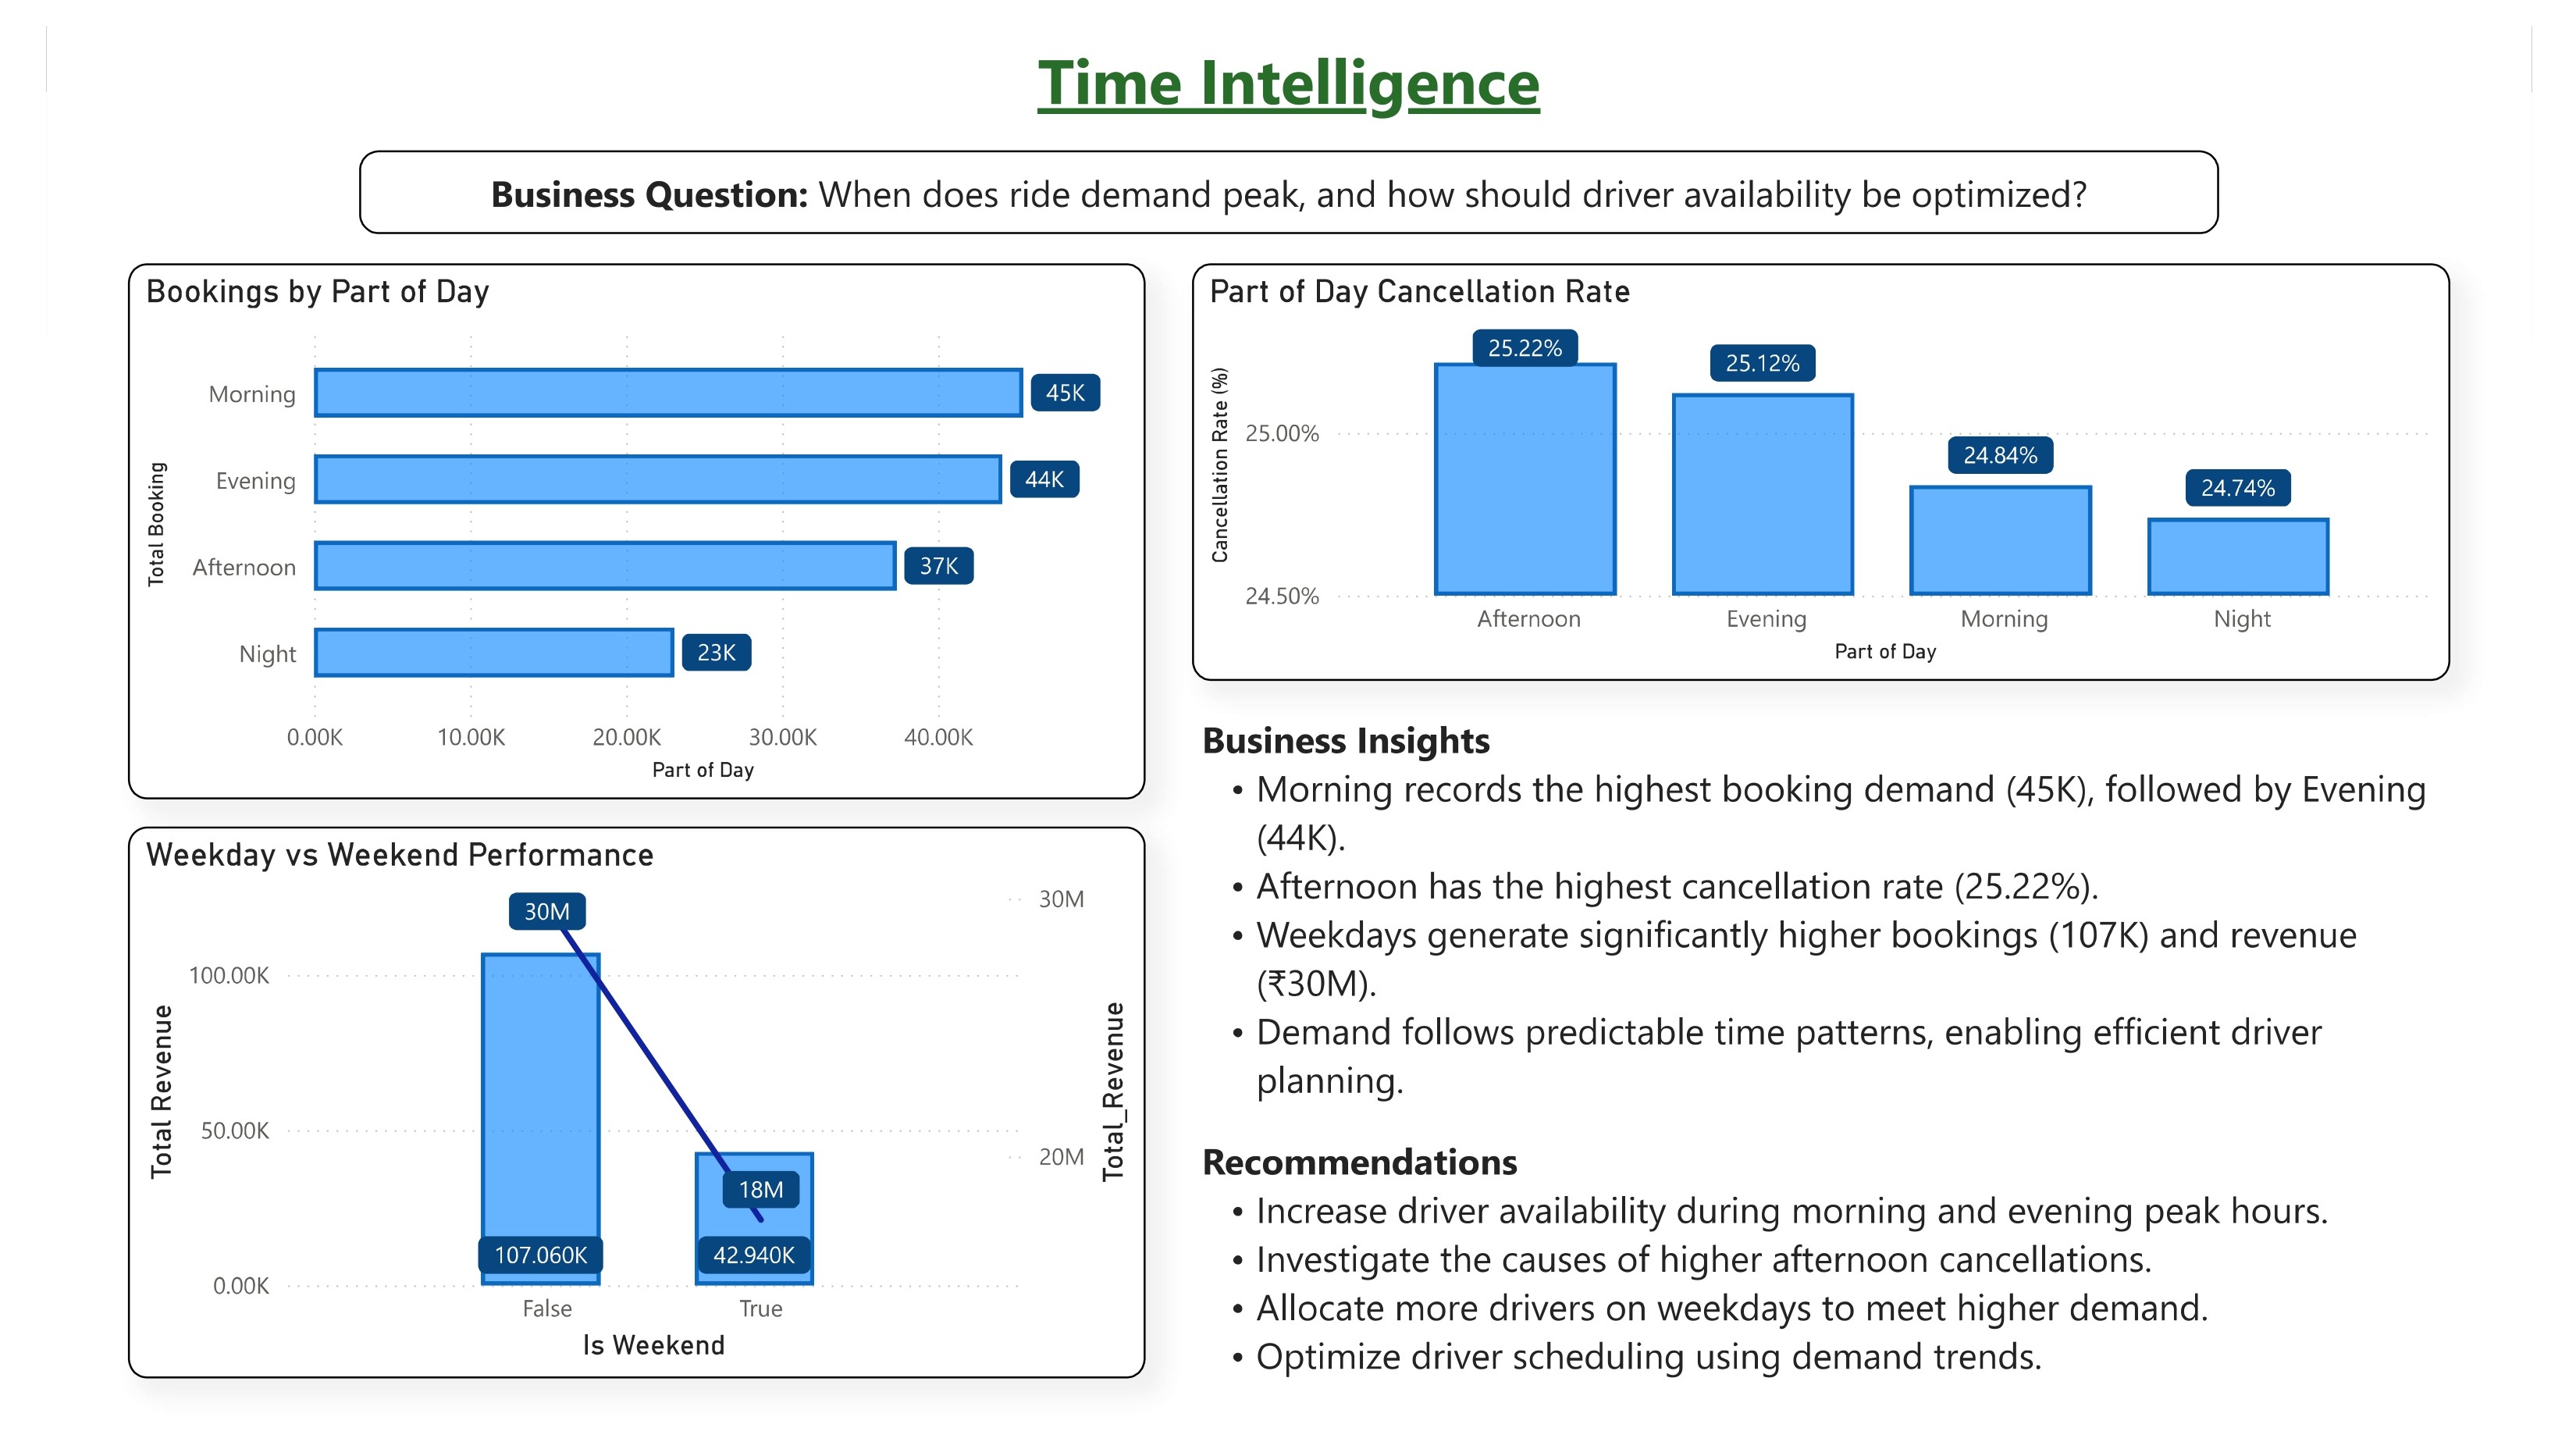
Time-series analysis showed that while mornings have high demand, afternoon hours suffer from the highest rate of driver cancellations.
4. Which payment method is most popular?
A breakdown of completed rides confirmed that UPI dominates as the preferred payment method for riders.
5. How do weekdays compare to weekends?
Using the Date dimension, I proved that weekdays significantly outperform weekends in total booking volume.
Power BI Dashboard
Report pages designed for business storytelling.
I structured the dashboard like a real analytics product, creating an 8-page report tailored for stakeholders with actionable insights.
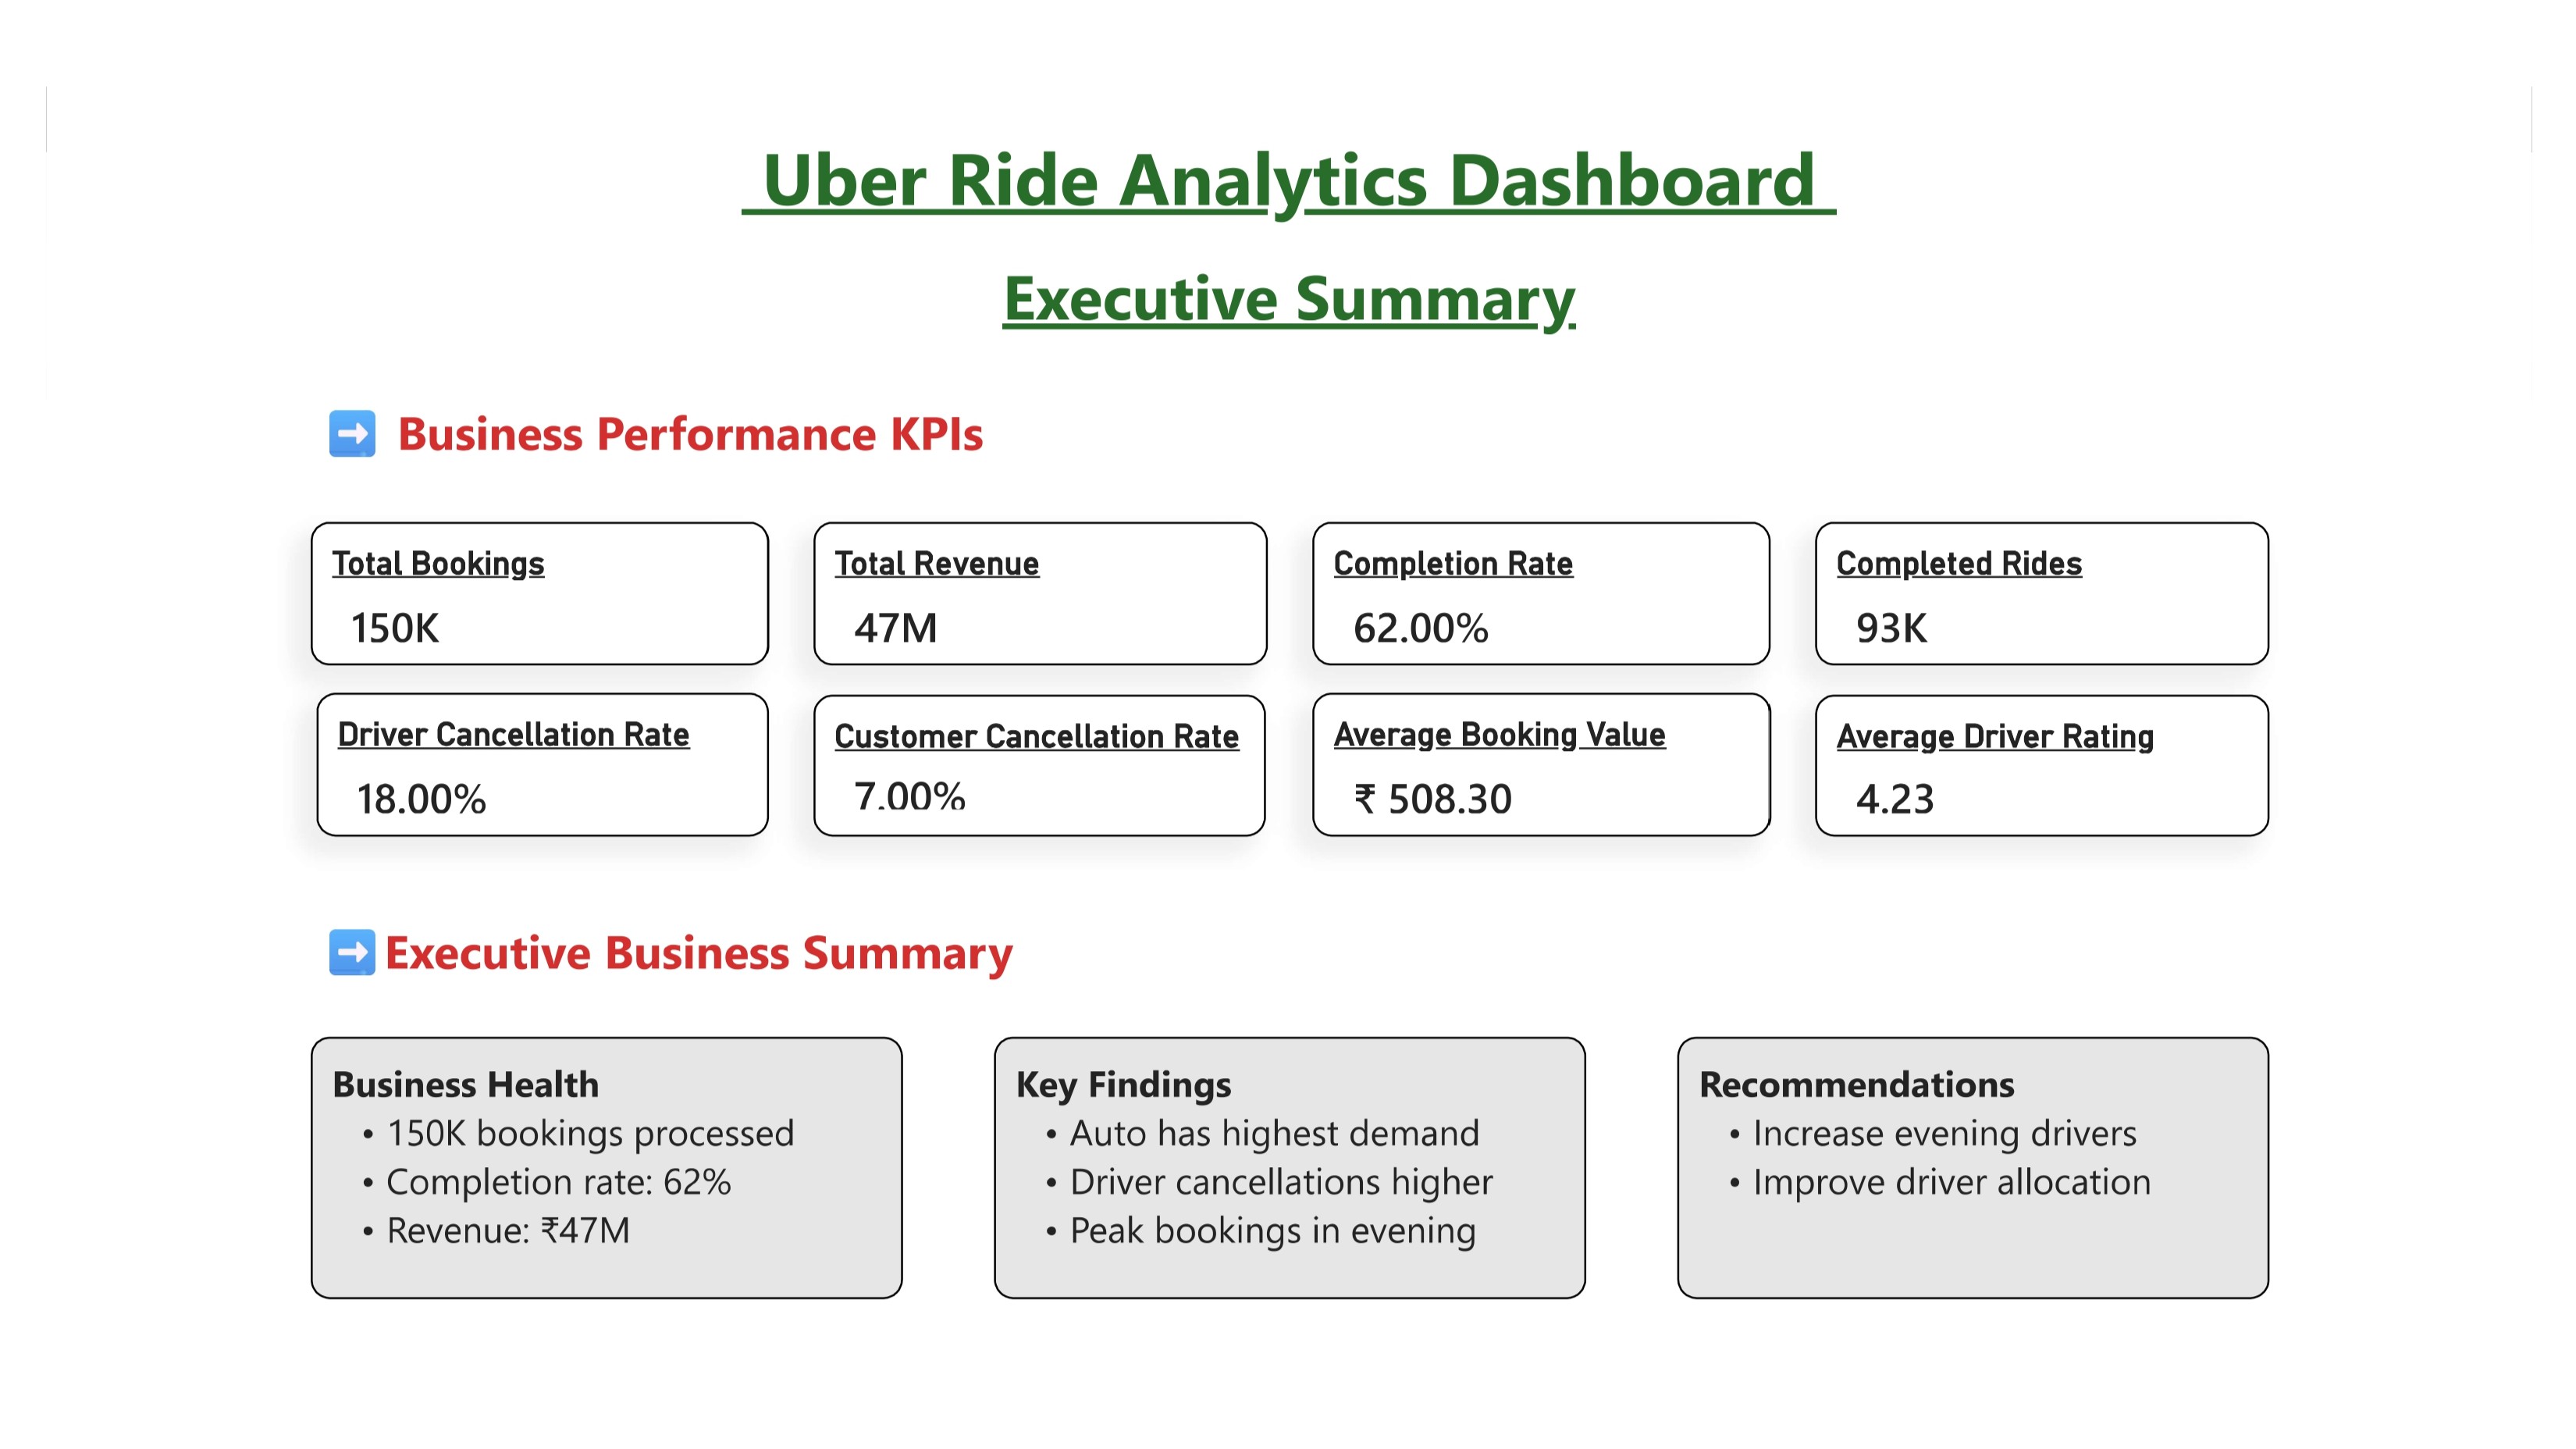
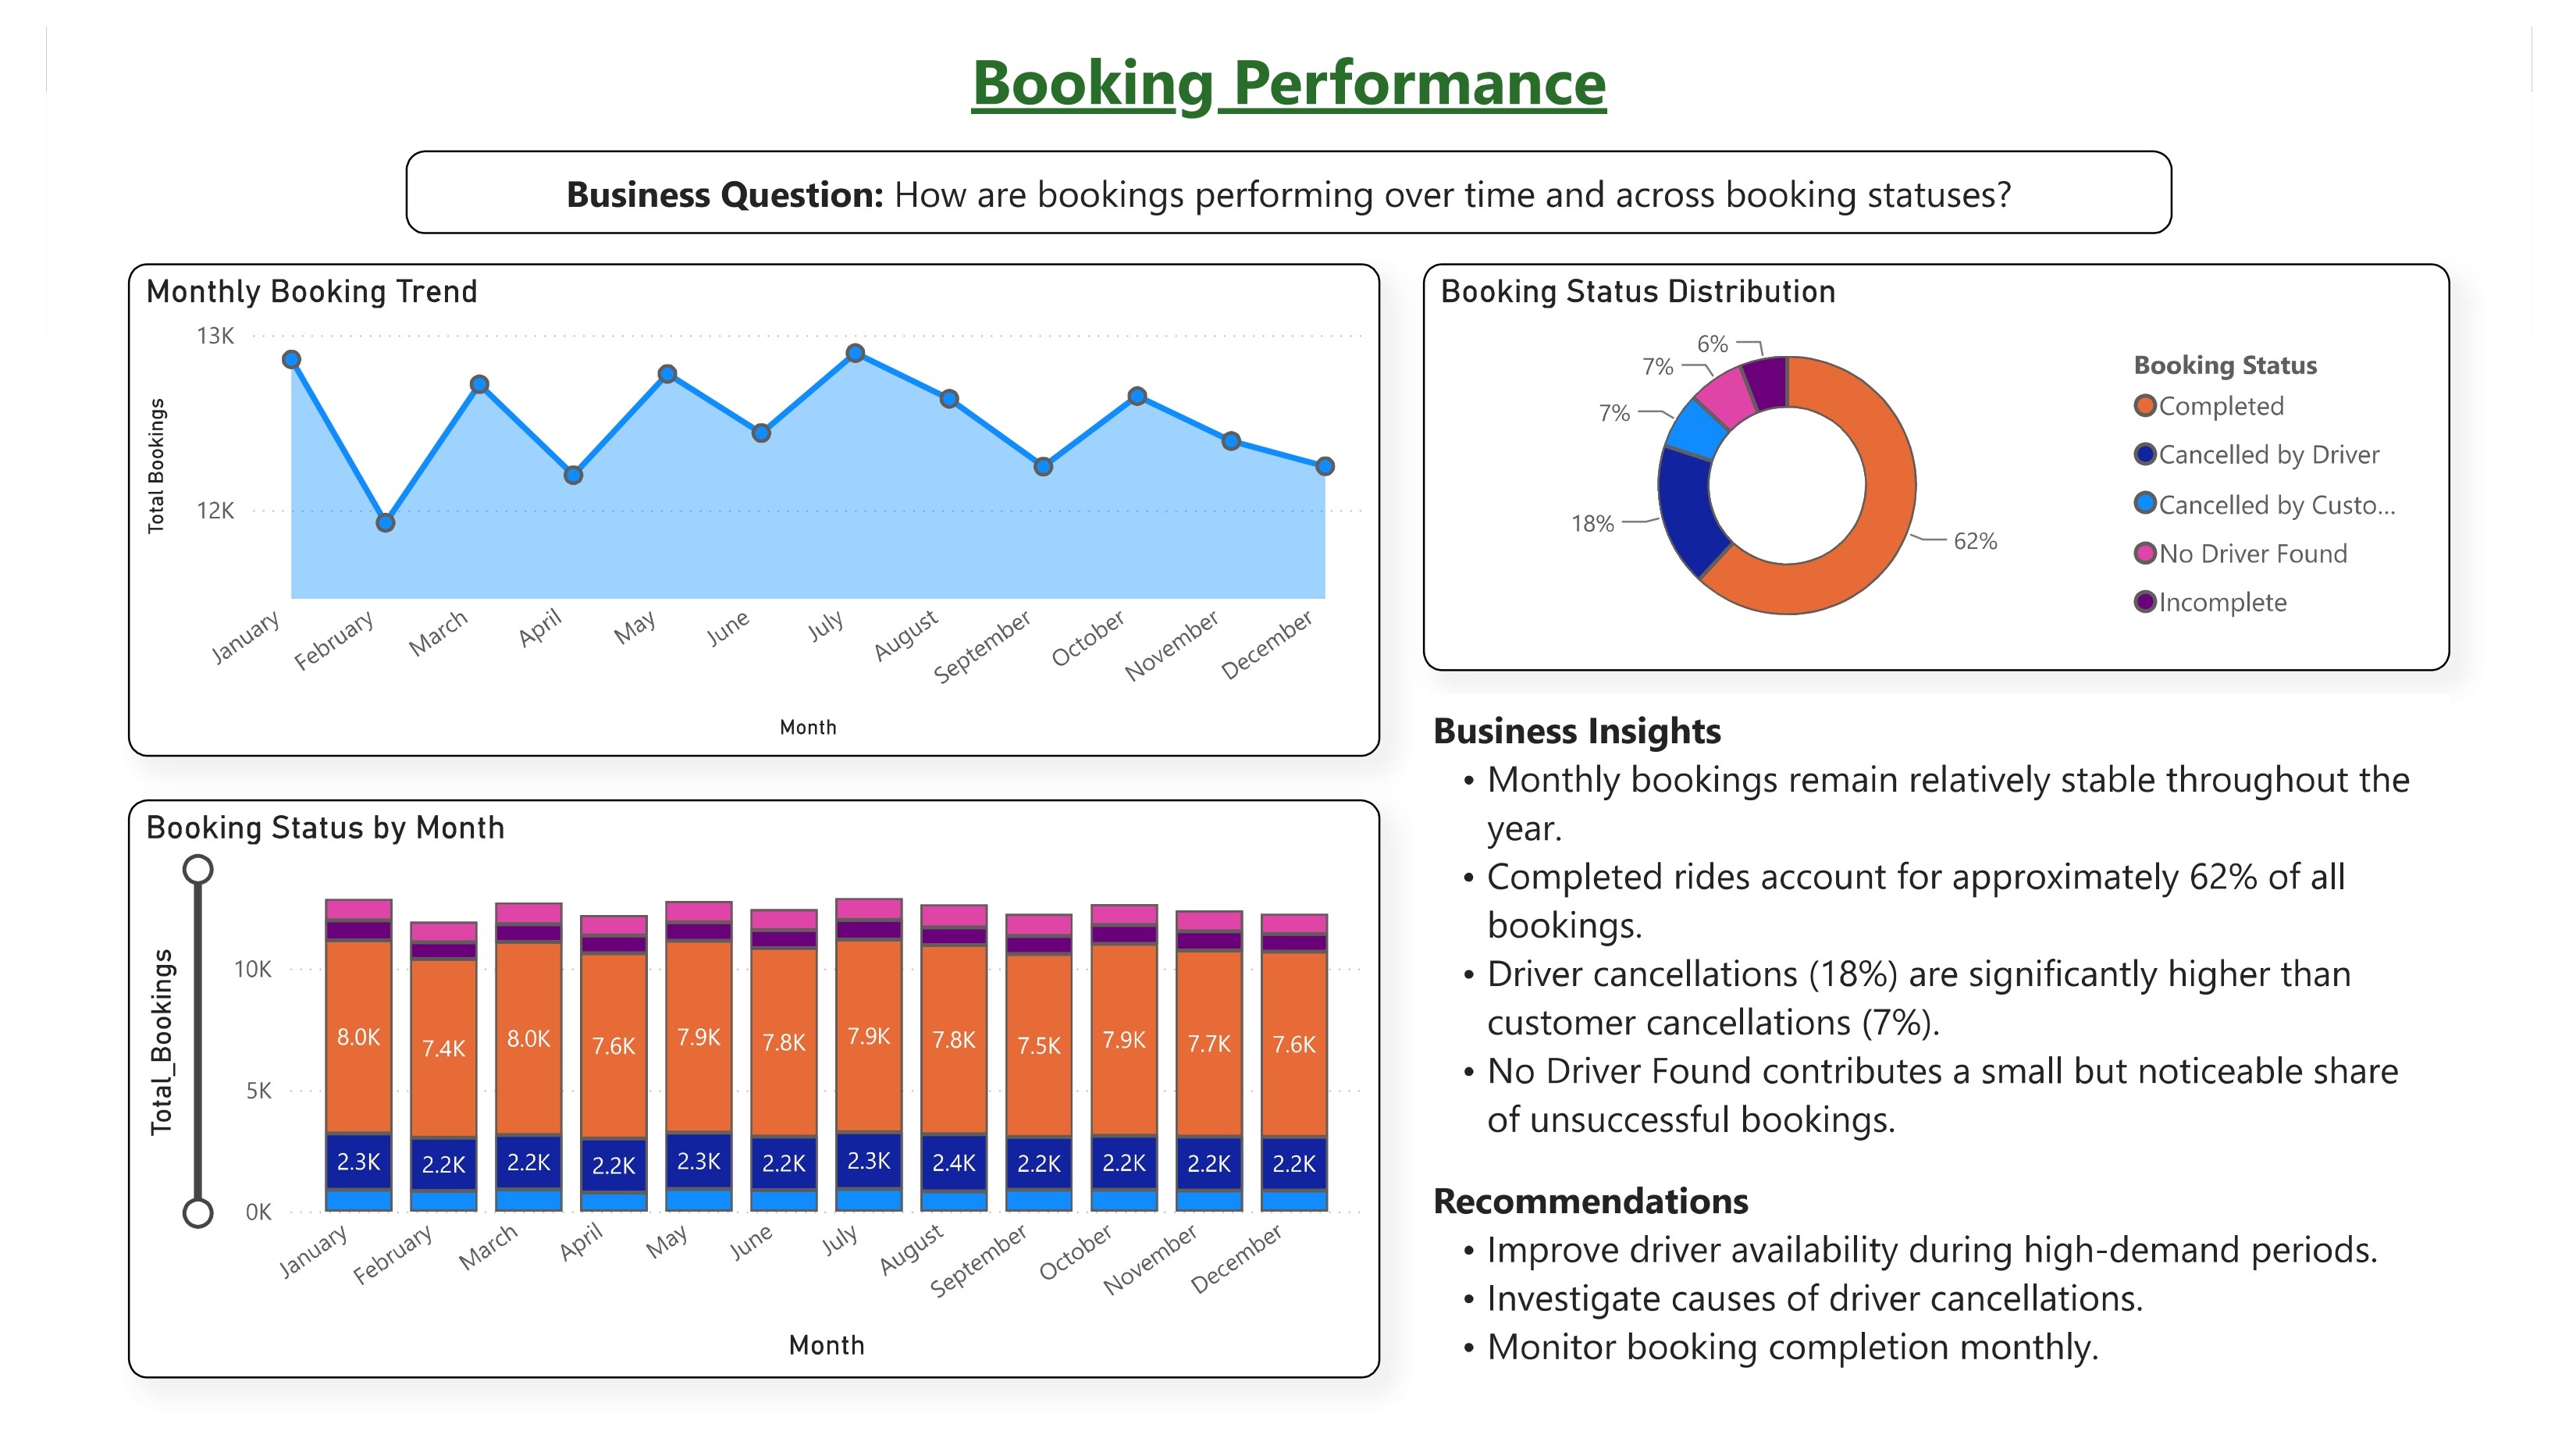
Business Insights
The dashboard turns analysis into decisions.
The dashboard pages pair visuals with documented insights and recommendations so the analysis moves from metrics to action.
Mornings and weekdays drive the bulk of ride demand.
- ✓ Mornings experience peak booking demand.
- ✓ Afternoons suffer highest cancellation rates.
- ✓ Weekdays outperform weekends in bookings.
Auto and UPI are the strongest revenue generators.
- ✓ Auto category leads overall revenue.
- ✓ UPI dominates as the top payment method.
- ✓ Barakhamba Road is the most lucrative hotspot.
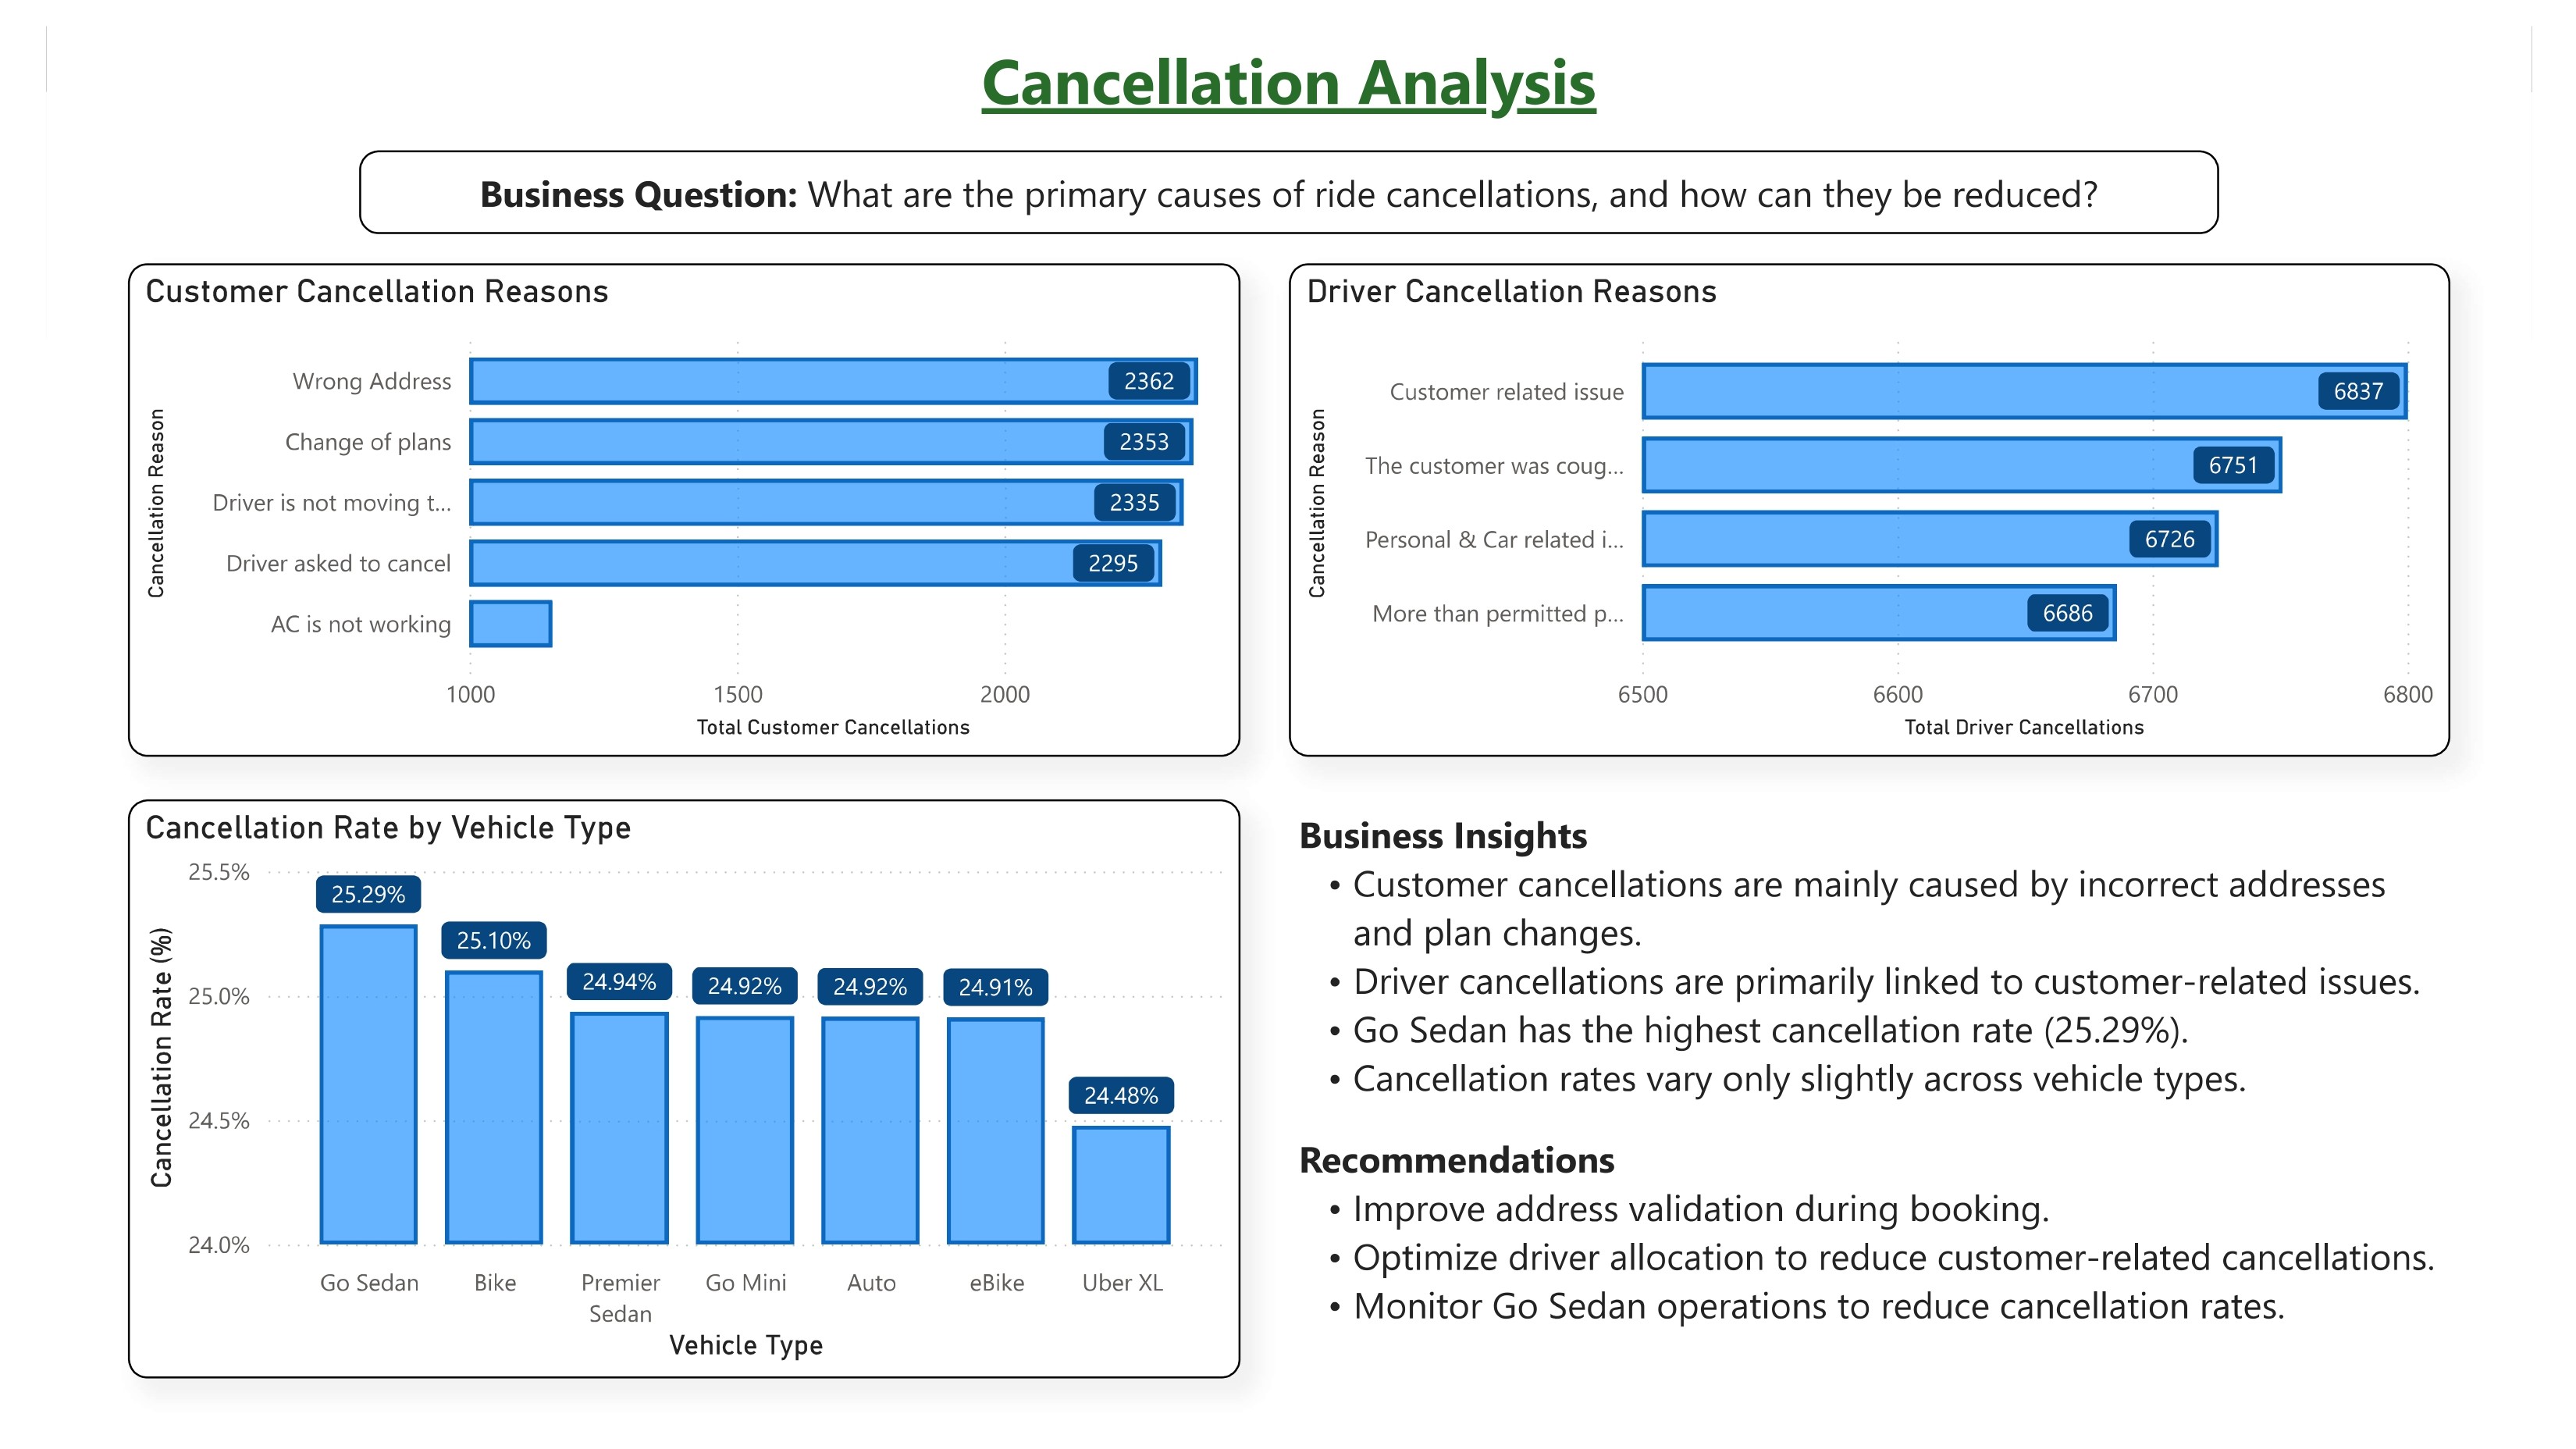
Incorrect addresses are a primary friction point.
- ✓ Incorrect addresses drive customer cancellations.
- ✓ Sudden plan changes are a major factor.
- ✓ 'Go Sedan' has the highest cancellation rate.
Skills Matrix
Tools and concepts applied.
Technical Skills
- ✓ Python & Pandas
- ✓ SQL & MySQL
- ✓ SQLAlchemy
- ✓ Power BI & DAX
- ✓ Data Modeling
Concepts
- ✓ ETL Pipelines
- ✓ Star Schema Design
- ✓ Data Warehousing
- ✓ Business Intelligence
- ✓ KPI Reporting & Visualization
Results & Key Learnings
Delivering technical and business value.
This project demonstrated my ability to solve messy data problems and deliver an end-to-end BI solution.
Technical Growth
I learned how to integrate Python, MySQL, and Power BI into a cohesive pipeline. Validating business rules during the ETL phase and structuring a Star Schema proved critical for enabling complex SQL queries later.
Business Impact
The final dashboard successfully translates raw operational data into clear, actionable insights regarding revenue drivers, cancellation bottlenecks, and demand forecasting.
Why this project stands out
This project demonstrates my ability to build an end-to-end Business Intelligence solution by combining Python, SQL, Data Warehousing, and Power BI into a single analytics workflow. Rather than focusing only on dashboard creation, I designed the complete pipeline—from raw operational data to executive-ready insights—following industry best practices used in modern BI teams.
Resources
Explore the project artifacts.
Explore the complete source code, including raw SQL queries, Python ETL notebooks, and detailed documentation on GitHub.
View Full Project on GitHub